The human cardiac translatome app was developed by the
Hubner lab
at the Max Delbrück Center in Berlin.
Gene expression in human tissue has primarily been studied on the transcriptional level, largely neglecting translational regulation. Here, we analyze the translatomes of 80 human hearts to identify new translation events and quantify the effect of translational regulation. We show extensive translational control of cardiac gene expression, which is orchestrated in a process-specific manner. Translation downstream of predicted disease-causing protein-truncating variants appears to be frequent, suggesting inefficient translation termination. We identify hundreds of previously undetected microproteins, expressed from lncRNAs and circRNAs, for which we validate the protein products
in vivo
. The translation of microproteins is not restricted to the heart and prominent in the translatomes of human kidney and liver. We associate these microproteins with diverse cellular processes and compartments and find that many locate to the mitochondria. Importantly, dozens of microproteins are translated from lncRNAs with well-characterized noncoding functions, indicating previously unrecognized biology.
This online tool offers an easy way to explore the human cardiac translatome data published in the accompanying paper:
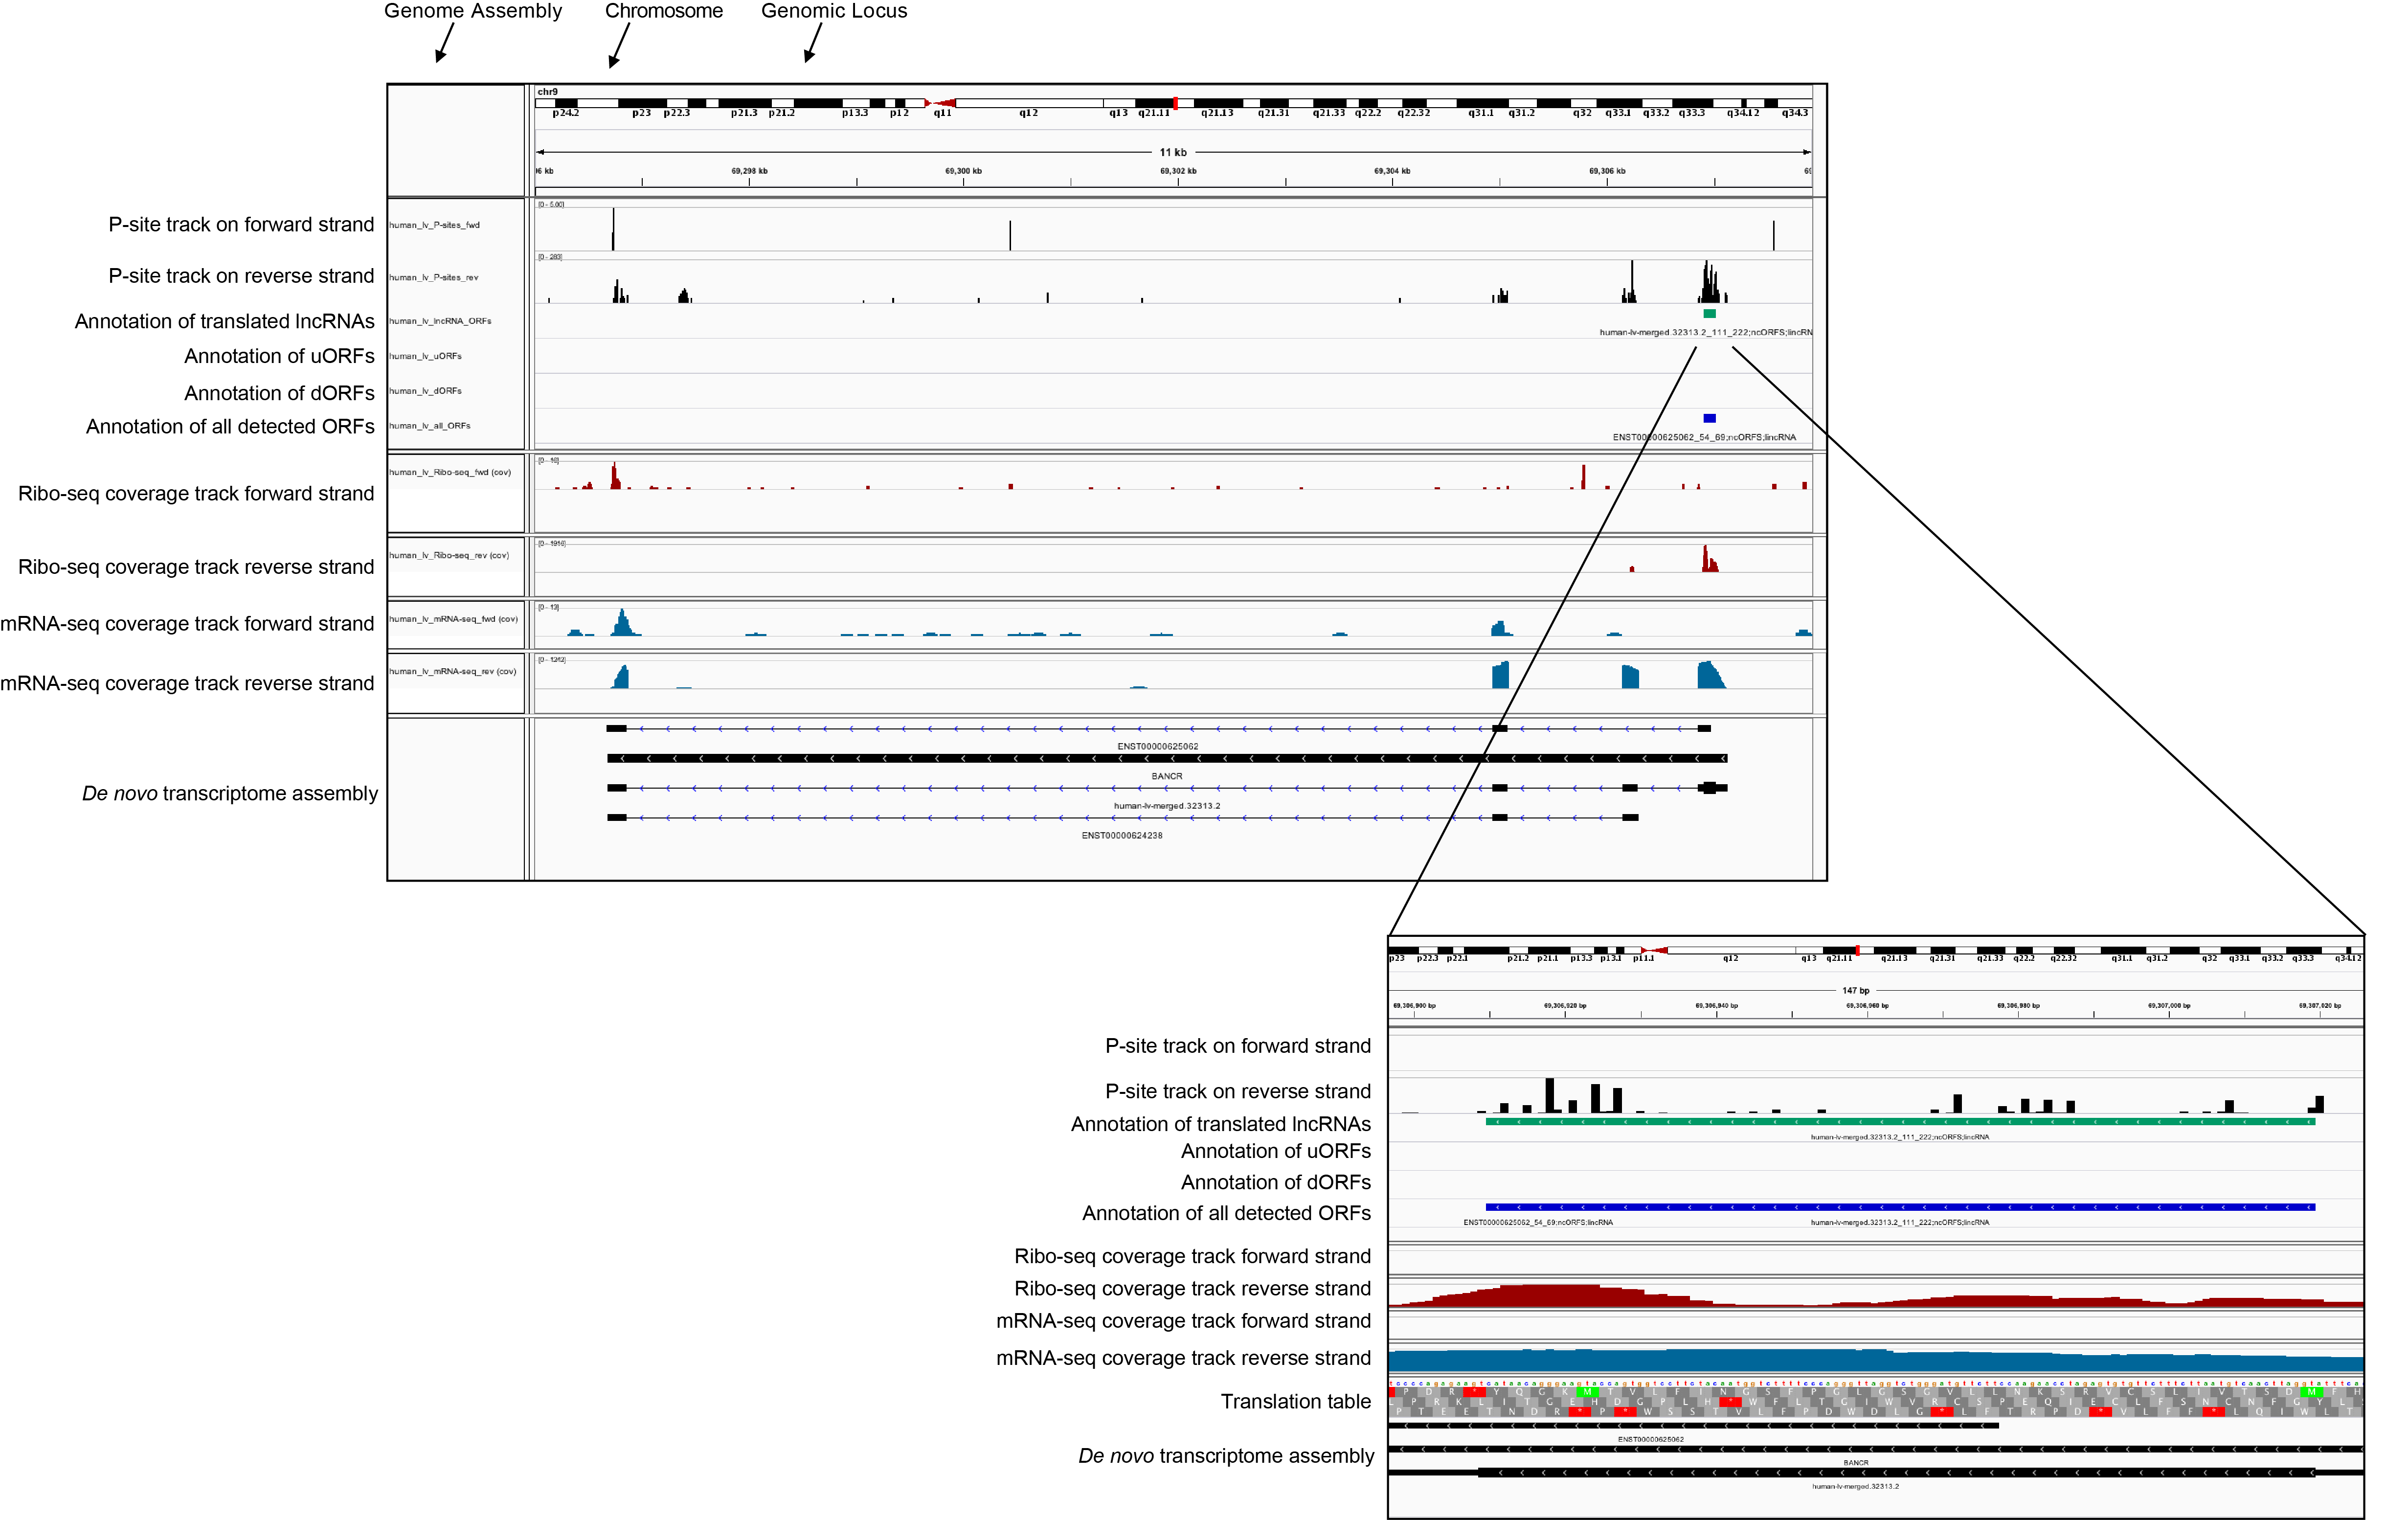
Inspect your translated genes and ORFs of interest using the Integrative Genomics Viewer (IGV)
The datasets generated in our study,
The translational landscape of the human heart
(van Heesch et al., 2019) can be downloaded and explored
using the Integrative Genomics Viewer (IGV)
(Robinson et al. 2011)
.
Here you can download a fasta file containing all ORFs that were detected in this study (this can be used as a proteomics search database): hs_cardiacTranslatome.fasta
To view the data in IGV 2.7 or greater, please perform the following steps:
If IGV is not installed locally, download and install it:
This table lists the differential expression results of all selected genes.
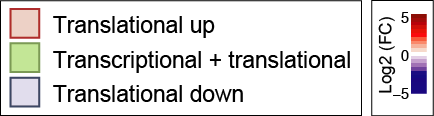
Fold change (FC) plots of selected genes
This plot shows all selected genes sorted from left to right based on the delta FC (DCM vs. control) of translation (Ribo-seq) over mRNA expression levels (mRNA-seq). For each gene, corresponding fold changes are depicted below the delta FC plot with color coding reflecting the intensity of the expression change, with genes upregulated in DCM in red and genes downregulated in blue.
Download Files
Download the text file of the differential expression table
Download the PDF with a box plot for each selected gene to visualize the mRNA-seq and Ribo-seq data individually.
Newly added on 28.04.2021: Here you can download a R-object containing DESeq2 normalized count matrices: hs_lv_DESeq2_norm.counts.RData
Information on translated lncRNAs (microproteins)
sORF information
This table contains ORF specific information that was derived using RiboTaper
(Calviello et al. 2016)
.
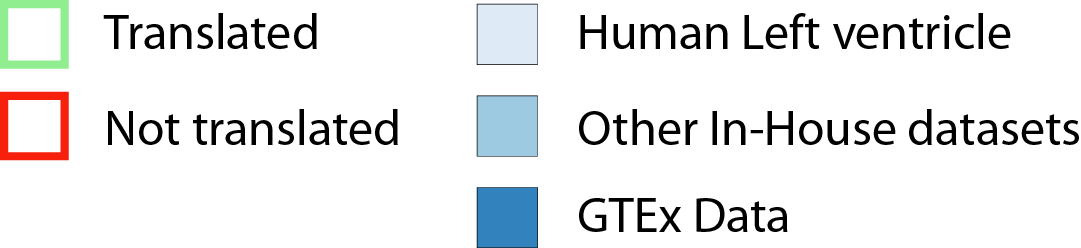
LncRNA expression and translation in the heart and other tissues or cell types
This plot shows gene-based expression levels of the selected translated lncRNA across different datasets.
LncRNA and sORF conservation to other species
This table summarizes the conservation of the translated lncRNA gene (positional conservation) and sORF (PhyloCSF and translation initiation site (TIS) conservation) in comparison to other vertebrates (PhyloCSF) and to the translatomes of mouse and rat left ventricles.
Summary of predicted peptide characteristics
This table lists predicted peptide characteristics including signal cleavage site (SignalP), localization (TargetP and DeepLoc) and transmembrane domain prediction (TMHMM).
In vitro
and
in vivo
evidence for microproteins
This table summarizes the evidence for microprotein production obtained with
in vitro
translation assays and
in vivo
public mass spectrometry searches
(Doll et al. 2017)
or targeted selected reaction monitoring (SRM).
I-TASSER protein structure prediction results
Genetic Associations
We performed genetic association testing of all translated genes in our dataset. Genetic variants with at least 5 samples showing the reference allele and 5 samples showing the alternative allele have been considered. Association testing was performed using MatrixEQTL
(Shabalin et al. 2012)
on transcription, translation and translation efficiency. More detailed information can be found in the methods section of
The translational landscape of the human heart
(van Heesch et al., 2019).
List of all genetic associations for selected gene
All significant associations (FDR ≤ 0.05) for the selected gene are listed here.
Gene expression of the most significant association separated by genotype